
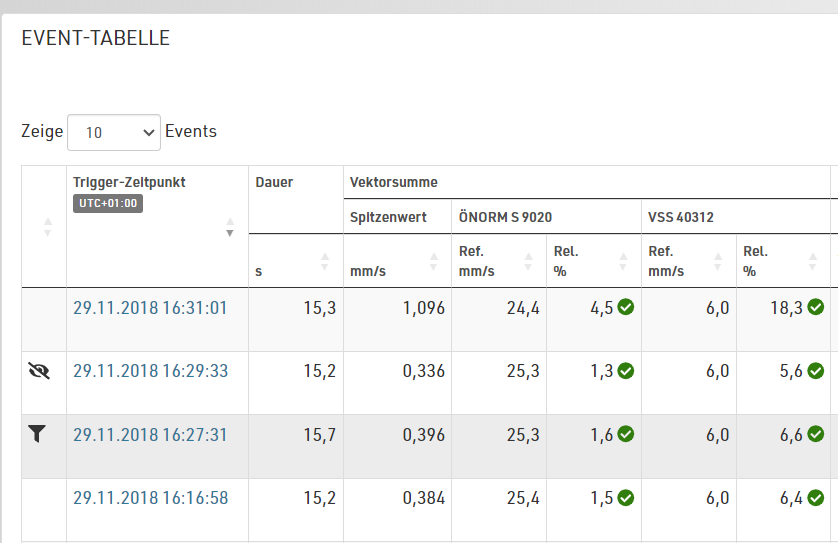
Seismic events can be easily and automatically analyzed in Sedrix according to common nation norms. According to the respective parameters, the threshold values are automatically determined for each event and the percentage of the permitted threshold value reached is calculated. These threshold values can for example be displayed clearly in an event table.
Available norms:
- DIN 4150-2
- DIN 4150-3
- ÖNORM S 9020 (1986 or 2015)
- VSS 40312
- F-Circulaire 86
- BS 7385-2
- UNE 22-381
If the list of available norms is insufficient, it is now possible to define your own constant or dynamic threshold values depending on the dominant frequencies of the seismic event.
Frequency-dependent threshold values are defined by using the variables fx, fy, fz and fmax for the dominant frequencies and the dominant frequency of the maximum peak value.
Example:
0,5*fx+15
Conditions can also be formulated to define a different threshold value depending on the frequency.
Example:
if(fx<20;10;15)
The conditions can be nested as required in order to represent even complex threshold value functions. To take the norm DIN 4150-3 as an example, the threshold value function would look like this:
f(fx<10;20;if(fx<50;0,5*fx+15;if(fx<100;0,2*fx+30;50)))
In this way Sedrix can be used to define even complex dynamic threshold value functions.
Version 5.4.0
09.11.2023
New features
- In addition to the existing norms (DIN 4150-3, DIN 4150-2, etc.), vibration events can now also be analyzed according to user-definable threshold values. Both constant threshold values and frequency-dependent threshold value functions can be defined for peak values of X,Y,Z and the vector sum.
- A prefix can now optionally be added to the file name of a report in the form “yyyy-mm-dd”, e.g. “2023-10-15 Report.docx”. The start time of the report is taken as the timestamp.
- When visualizing measuring points/folders on maps, the zoom level can now be selected in the folder properties. The default setting is “Automatic” – this automatically enlarges the map section so that all measuring points and folders are visible;
Fixed bugs
- In diagrams with a secondary value axis, which is drawn separately below, alarm limits of the primary axis have been drawn in. This was not intended, especially as the unit of the secondary axis can deviate;
- The upload of inclinometer measurements from GLM no longer worked in version 5.3.1.
- Under certain circumstances it could happen that the device name of a menhir was not adopted during import;
- When re-uploading vibration events, an error could occur during import if the events were relatively old.
- For vibration measuring points in a report in list mode, further evaluations could be added by mistake. At this point, however, it is only intended to select evaluation views of the respective measuring points;