
You can use Sedrix to import and evaluate measurements from inclinometer probes. Common evaluations are:
- Measured value table and measured value diagram
- Borehole trajectory (table and diagram)
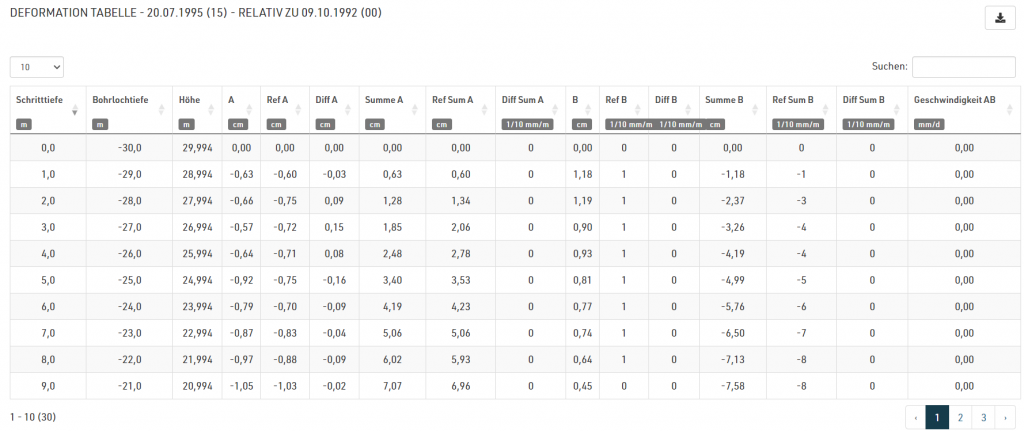
- Deformation (table and diagram)
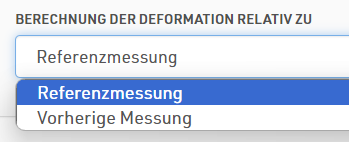
Deformation generally shows the trajectory of a borehole relative to the reference measurement. In this version we have added the option of also calculating the deformation relative to a previous measurement.
This option can be selected in the evaluation properties:
Version 5.4.8
28.06.2024
New features
- Measuring point channels can now be displayed (again) in the visualization.
- Inclinometer measurement: In a deformation table it is now possible to display the deformation relative to the previous measurement.
- Seismic measurements: third-octave diagrams of a seismic event can now also be exported as CSV tables.
Fixed bugs
- When duplicating measuring points, not all properties were copied (e.g. tolerance interval).
- If many logbook entries were to be displayed in a diagram, it was possible that some were not visible.
- Seismic measurements: When hiding large numbers of events, it was possible that not all interval data was hidden.
- Seismic measurements: There was a discrepancy in how interval data diagrams were displayed on the web and in the report.
- Saving changes to a visualization sometimes failed in Firefox.